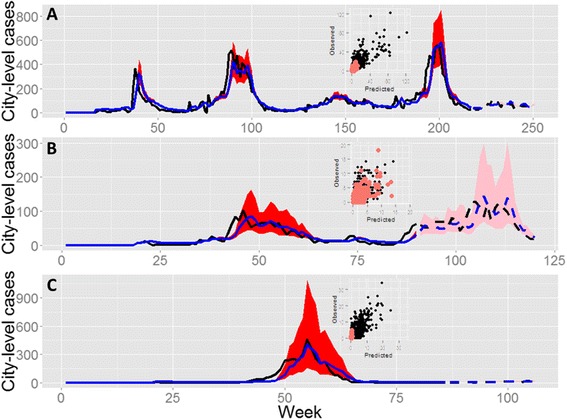
Figure 5.

City-level summary of full-model fits for three cities. Models were fitted using neighborhood-level data but aggregated to the city level for presentation. Observed data (black lines; solid: in-sample, dashed: out-of sample); model predictions (blue lines; solid: in-sample, dashed: out-of sample), 97.5% credible intervals (red shades: in-sample; pink shades: out-of-sample). Insets display the neighborhood-level fits (black points: in-sample data; pink points: out-of-sample data). Best full model from each city is presented. (A) Vitoria: Y i,t = β 1 M i,t-13 + β 2 Y i,t-1 + β 3 M i,t-1 Y i,t-1 + β 4∑j M j,t-5 0.1 + β 5∑j(Y j,t-1 /d ij) 0.5 + β 6∑j(M j,t-1 Y j,t-1 /d ij) 0.1 + log(P i) + π i. (B) GV: Y i,t = β 1 M i,t-2 + β 2 Y i,t-1 + β 3 M i,t-4 Y i,t-4+ β 4∑j M j,t-1 2 + β 5∑j(Y j,t-1 D j) 0.1 + β 6∑j(M j,t-1 Y j,t-1 D j) 0.5 + log(P i) + π i. (C) SL: Y i,t = β 1 M i,t-6 + β 2 Y i,t-1 + β 3 M i,t-1 Y i,t-1 + β 4∑j M j,t-6 0.1 + β 5∑j(Y j,t-1 R j) 0.001 + β 6∑j(M j,t-1 Y j,t-1 R j) 0.1 + log(P i) + π i.; notation is as in Figure 4.
