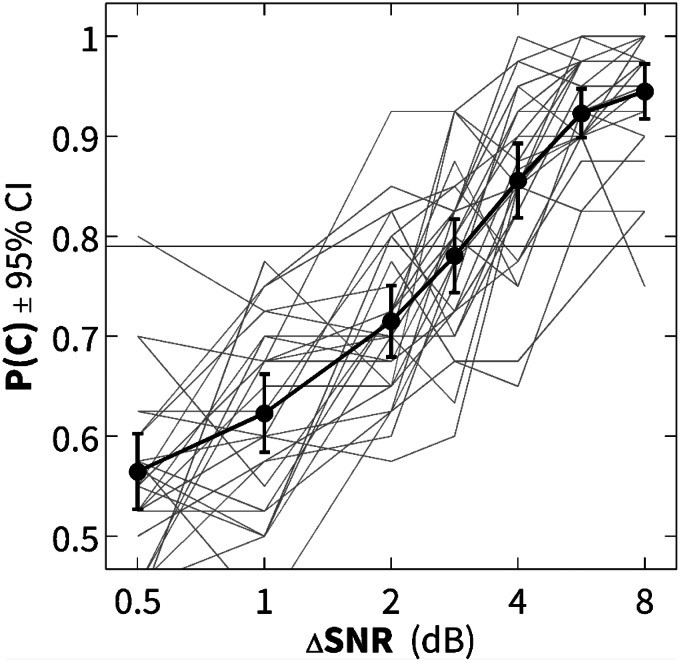
Figure 3.
Proportion correct for all participants in the fixed-level SNR discrimination task as a function of ΔSNR (dB). Black line shows mean values of all participants at each ΔSNR tested; error bars show 95% confidence intervals. The horizontal line shows equivalent of 79% correct as estimated by the 3-down/1-up procedure in Experiment 1. SNR = speech-to-noise ratio.

