
Figure 4.
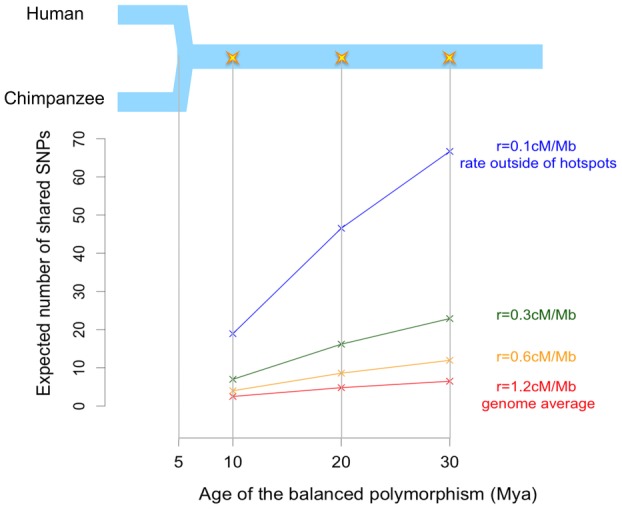
Expected number of shared SNPs in the contiguous ancestral segment. The upper panel is a schematic diagram of the demographic history of humans and chimpanzees, which merged into an ancestral species five million years ago (Mya). The star indicates the age of the balanced polymorphism. The lower panel shows the expected number of shared SNPs (including the selected one) in the two-sided contiguous ancestral segment. Note that the age of the balanced polymorphism here is measured from present, which is the sum of TS and the lengths of stages I and II.