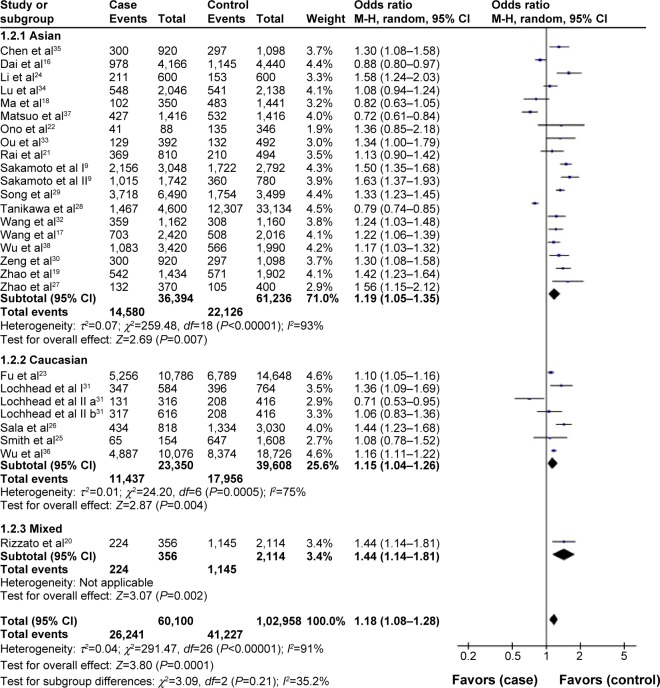
Figure 3.
Forest plots of PSCA rs2294008 polymorphism and cancer risk in the overall population and each subgroup stratified by ethnicity (T vs C).
Notes: The squares and horizontal lines correspond to the study specific OR and 95% CI. The area of the squares reflects the weight (inverse of the variance). The diamonds represent the summary OR and 95% CI.
Abbreviations: CI, confidence interval; OR, odds ratio; M–H, Mantel–Haenszel.

