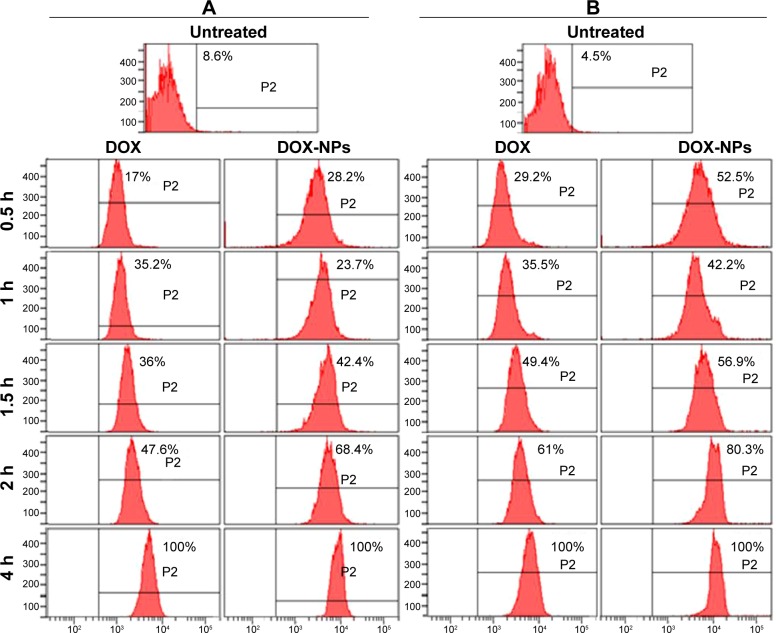
Figure 5.
Fluorocytometric analysis of the intracellular presence of DOX in MCF-7 (A) and E0771 (B) cells.
Notes: Representative image of the FACScan analysis and mean values of untreated cells and cells treated with free DOX and DOX-loaded PBCA NPs (DOX-NPs) at the highest concentration (43.1 μM) over a 4 h period.
Abbreviations: DOX, doxorubicin; PBCA NPs, poly(butylcyanoacrylate) nanoparticles; h, hours.

