
Figure 1.
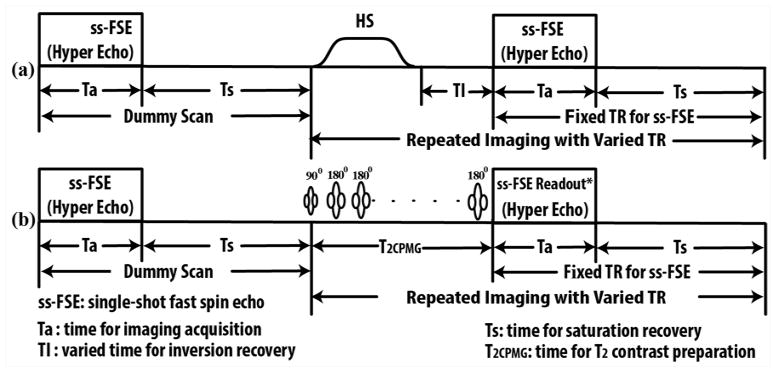
T1 and T2 mapping sequence diagrams: (a) Sequence diagram for T1 mapping using varied inversion times after an initial dummy scan. Inversion was accomplished by a hyperbolic secant (HS) RF pulse. (b) Sequence diagram for T2 mapping using a Carr-Purcell-Meiboom-Gill style refocusing echo train (T2CPMG) with varying numbers of refocusing echoes. To minimize the short-term specific absorption rate (SAR) at 7T, the ss-FSE readout employed the use of hyperechoes. Note: *ss-FSE readout refers to the data sampling for refocused echoes excluding the RF excitation.