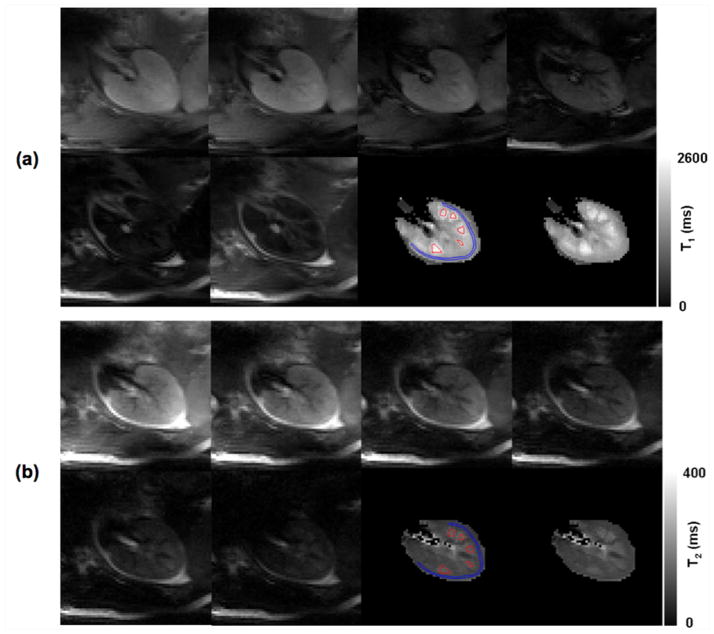
Figure 3.
7T T1 and T2 imaging results from one typical subject: (a) ss-FSE images were acquired by using six inversion times 100, 150 300, 500, 800 and 1200 ms; (b) ss-FSE images were acquired by using six different effective echo times: 20, 40, 80, 120, 160, and 200 ms. The conservatively defined ROIs (blue for the cortex and red for the medulla) used for the estimation of renal T1 and T2 are overlaid on the T1 and T2 maps generated from pixel-wise fitting.

