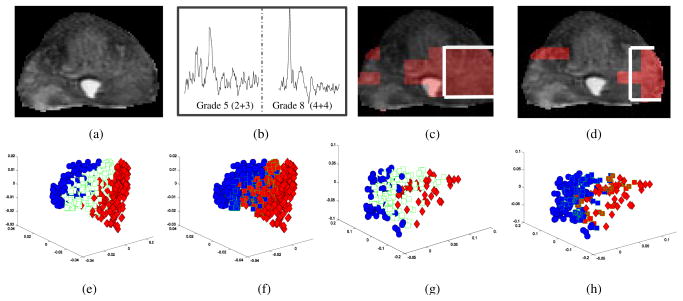
Fig. 2.
(a) Original T2w MRI, (b) MRS signatures for high/low grade CaP. Red regions on (c)–(d) show the classification results obtained using SeSMiK-GE for identifying CaP and high grade CaP on in vivo MRI, MRS. White ROI delineates the ground truth for CaP extent in (c) and high-grade CaP in (d). (e), (g) show 3D embedding plots obtained from SeSMiK-GE (with partial training labels for each class) for cancer metavoxels (red) and benign metavoxels (blue). The spectra in the evaluation (test set) are shown via green squares. (f), (h) illustrate the classification results via PBTs on the same embedding for detection of CaP ((f)), and high-grade CaP ((h)).

