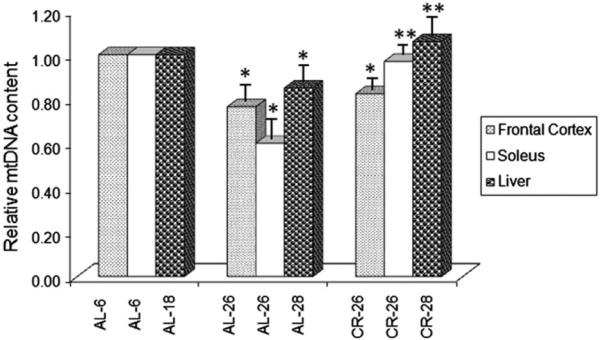
Fig. 6.
Age- and CR-related changes of the relative mtDNA content. The histogram shows the mean value of the ratio mtDNA/nuclear DNA in AL and CR rats. Bars represent the mean (±SE) obtained, respectively, from analysis in triplicate of total nucleic acids from each AL-6, AL-18, AL-26, AL-28, CR-26 and CR-28 rat. The groups of assayed animals included, respectively, five AL-6, five AL-18, six AL-26, six AL-28, five CR-26 and five CR-28 rats. *p < 0.05 versus the value of the younger rats (AL-6 or AL-18 fixed as 1); **p < 0.05 versus the value of the old AL rats (AL-26 or AL-28).

