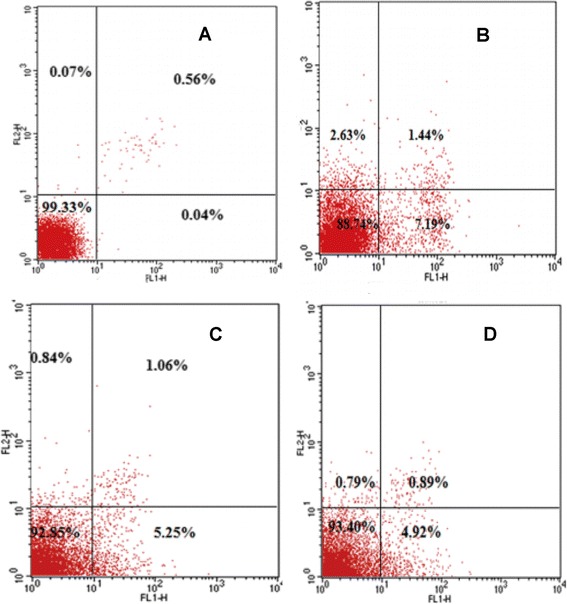
Figure 3.

Modulation in H 2 O 2 induced apoptosis by wogonin. A: control group. B: 200 μmol/l H2O2. C. 200 μmol/l H2O2+ 50 m/l wogonin. D. 200 μmol/l H2O2+ 100 m/l wogonin. The S.D. was below 65% in all cases. Results are representative of three separate experiments.
