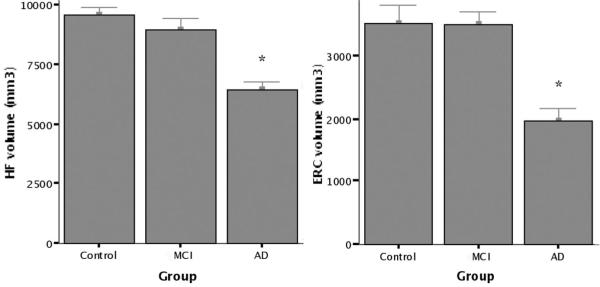
Figure 4.

Group mean volumetric MRI data. Standard manual volumetric protocols were used to measure regions of interest (ROIs) for the hippocampal formation (HF) and entorhinal cortex (ERC) from each individual subject’s structural MRI. Total volume (left + right) is displayed for each ROI. There was no significant difference in volumes between controls and mild cognitive impairment (MCI), but patients with Alzheimer disease (AD) demonstrated evidence of atrophy (*p < 0.0005).
