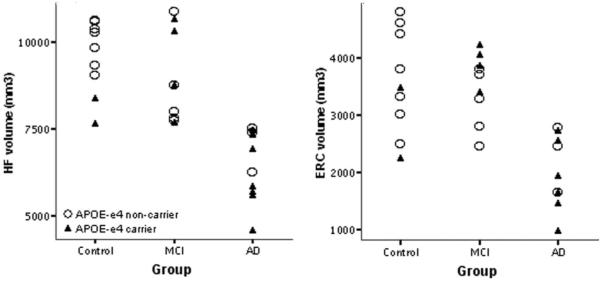
Figure 5.

Hippocampal (HF) and entorhinal (ERC) volume by clinical group and APOE genotype. Data points indicate total (left + right) volume of each region of interest (ROI). As shown in figure 3, the mean volumes of both ROIs are smaller in the Alzheimer disease (AD) group; no APOE effects or group by genotype interactions were observed. MCI = mild cognitive impairment.
