
Figure 5.
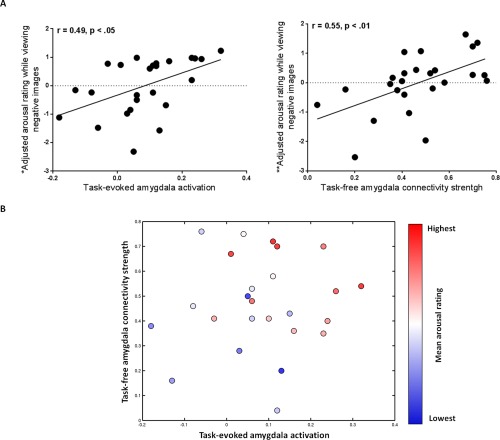
Greater task‐evoked amygdala activation and stronger task‐free dorsal amygdala connectivity within the salience network each contributed independently to feelings of arousal. (A, left graph) *The y axis displays the residual variance in mean arousal rating after the variance due to task‐free dorsal amygdala connectivity within the salience network has been removed; the scatterplot illustrates the relationship between adjusted arousal rating and task‐evoked amygdala activation. (A, right graph) **The y axis displays the residual variance in mean arousal rating after the variance due to task‐evoked amygdala activation has been removed; the scatterplot illustrates the relationship between adjusted arousal rating and task‐free dorsal amygdala connectivity within the salience network. (B) Individuals that displayed both increased task‐evoked amygdala activation and stronger task‐free dorsal amygdala connectivity within the salience network had the highest mean arousal rating while viewing negative images (total variance in mean arousal rating predicted by the independent variables was R 2 = 0.45, p < 0.01). Individuals with the highest level of mean arousal rating are shown in red, those with a medium level of mean arousal rating are shown in white and those with the lowest level of mean arousal rating are shown in blue. [Color figure can be viewed in the online issue, which is available at http://wileyonlinelibrary.com.]