
Figure 2.
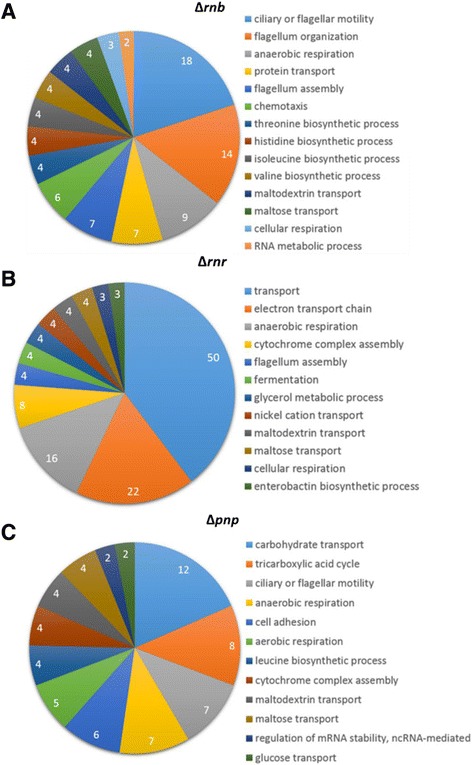
Differential expression analysis of the transcriptome of the exoribonucleases mutants. Differentially expressed transcripts distribution in different functional categories. A) The differentially expressed transcripts between ∆rnb and wild-type. B) The differentially expressed transcripts between ∆rnr and wild-type. C) The differentially expressed transcripts between ∆pnp and wild-type. Transcripts were grouped into different functional categories but only the Gene Ontology category of biological process is represented. These results were obtained using GeneCodis [35].