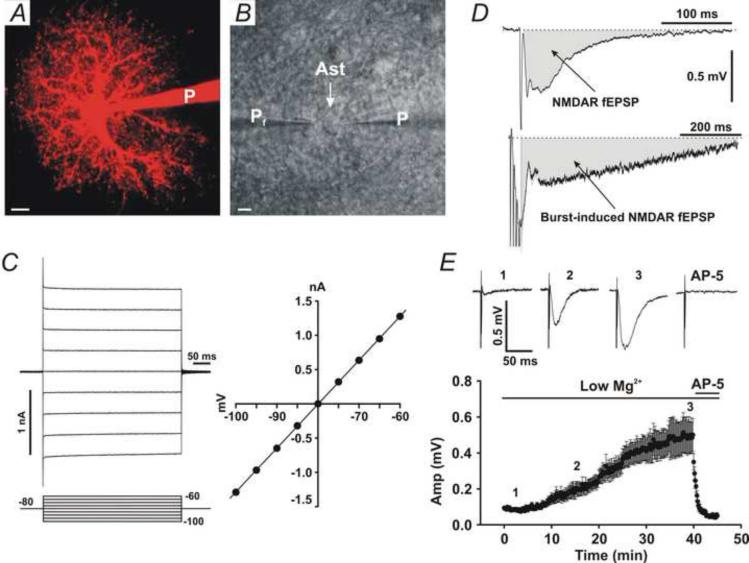
Fig. 1. Passive astrocytes and measurement of NMDAR fEPSPs.
(A) Two-photon microscopy imaging of a passive astrocytes patched with Alexa Fluor-594 (100 μM). (B) DIC imaging of a passive astrocyte (Ast) patched by a patch pipette (P). A field recording pipette (Pf) was placed in the immediate vicinity of the patched astrocyte. Scale bars in A and B, 5 μm. (C) Left traces, whole-cell voltage-clamp recording from a passive astrocyte showing membrane currents in response to voltage steps (Bottom lines). The number indicates voltage in mV. Right panel, the I-V curve shows a linear I-V relationship. (D) Upper trace, measurement of a testing stimulus-induced NMDAR fEPSP (Grey area). Bottom trace, measurement of a burst stimulation-induced NMDAR fEPSP (Grey area). Data are from a representative experiment. (E) Changes in NMDAR fEPSPs in low Mg2+ solution during recording. Upper traces, representative NMDAR fEPSP traces from the time indicated in the bottom panel (1, 2, and 3). Bottom panel, time-dependent changes in NMDAR fEPSP amplitude (Amp).

