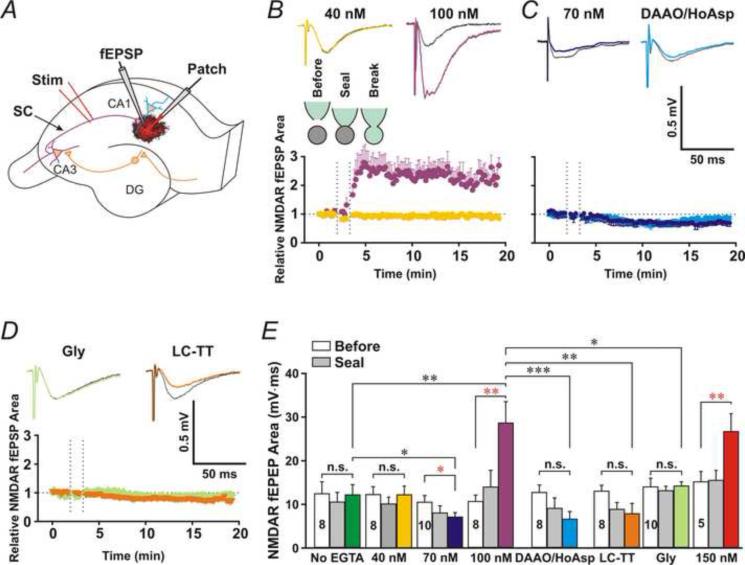
Fig. 2. High astrocytic [Ca2+] enhances synaptic activation of NMDARs.
(A) Experimental arrangement: NMDAR fEPSP (fEPSP) was recorded from the immediate vicinity of a patched passive astrocyte (Patch). (B) Upper traces, representative NMDAR fEPSPs before (Black traces) and after (Colored traces) patching astrocytes with the 40 or 100 nM [Ca2+] patch pipette solution. Bottom panel, the time course of the relative area under the curve of NMDAR fEPSPs for control (Green) or 100 nM [Ca2+] (Purple) pipette solution. The dashed lines indicate the start time of the cell-attached (Seal) and whole-cell configurations (Break). (C) Patching astrocytes with the 70 nM [Ca2+] patch pipette solution (Blue) or the 100 nM [Ca2+] patch pipette solution containing DAAO (50 μg/ml) and HoAsp (400 μM) (Cyan) decreased NMDAR fEPSPs. (D) Saturation of NMDAR glycine sites with bath application of glycine (Gly, 0.1 mM, Moon green) or intracellular application of vesicular fusion toxin LC-TT (0.3 μM, Orange) blocked the astrocytic [Ca2+]-induced increase. (E) Statistic data for the mean area under the curve of NMDAR fEPSPs before (Open bars) and after patching astrocytes in the cell-attached (Grey bars) and whole-cell (Colored bars) configuration. Data are presented as average SEM. *, **, and *** denote P < 0.05, 0.01 and 0.001, respectively, paired t-test (Red) or Student's unpaired t-test (Black). n.s., no statistical significance.

