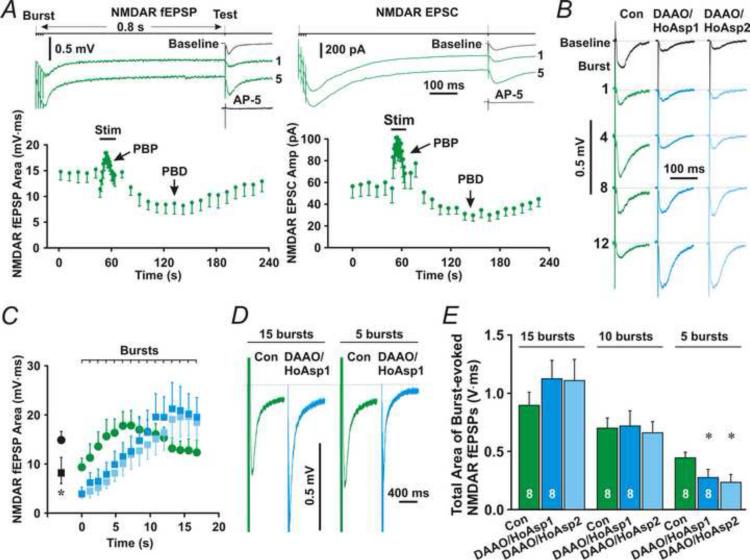
Fig. 8. Effects of astrocytic D-serine on TBS-induced NMDAR activation.
(A) Left upper traces are NMDAR fEPSPs evoked by the first (1) or fifth (5) burst (Burst) followed by test stimulus-induced NMDAR fEPSPs (Test). A nearby astrocyte was patched with the control pipette solution. Left bottom panel, the time course of test stimulus-induced NMDAR fEPSPs before, during, and after the burst stimulation (Stim), showing post-burst potentiation (PBP) and post-burst depression (PBD). Right upper traces, whole-cell recording from a representative pyramidal neuron showing NMDAR EPSCs evoked by the first or fifth burst followed by test stimulation. Right bottom panel, the time course of NMDAR EPSCs. (B) Representative field potential recording traces showing test stimulus-evoked NMDAR fEPSPs following the first (1), fourth (4), eighth (8), or twelfth burst (12) in the absence (Con) or presence of DAAO (50 μg/ml) and HoAsp (400 μM) in astrocytes (DAAO/HoAsp). DAAO/HoAsp1 and DAAO/HoAsp2 denote NMDAR fEPSPs during the first and second trains of the burst stimulation, respectively. The black traces (Baseline) are baseline NMDAR or AMPAR fEPSPs before the burst stimulation. (C) The mean area under the curve of NMDAR fEPSPs evoked by test stimuli after each burst (Burst). (D) Averaged burst-evoked NMDAR fEPSPs for total 15 (15 bursts) or first 5 (5 bursts) bursts from a representative experiment. (E) The mean total area under the curve of burst-evoked NMDAR fEPSPs for total 15 (15 bursts), first 10 (10 bursts), or first 5 (5 bursts) bursts. * denotes P < 0.05 compared to control, Student's unpaired t-test. The sample size is given in left two bars.

