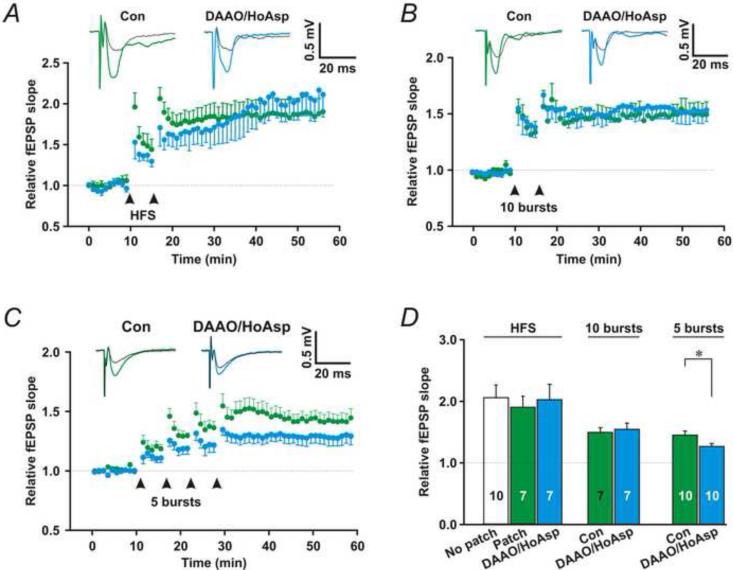
Fig. 9. Astrocytic D-serine release facilitates LTP induction.
(A)-(C) Upper traces, representative fEPSPs before (Black traces) and after LTP induction (Colored traces) in the absence (Green) or presence of DAAO and HoAsp (Cyan) in nearby astrocytes. Bottom panels, the relative slopes of fEPSPs. LTP was induced by HFS delivered twice (A, arrows), TBS consisting of 10 bursts delivered twice (B, arrows), or TBS consisting of 5 bursts delivered four times (C, arrows). (D) Summary for LTP induction in A-C. Red * and ** denote significance of P < 0.05 and 0.01, respectively, compared to baseline (paired t-test); Black *, **, and *** indicate P < 0.05, 0.01, and 0.001, respectively, compared to the control group or 100 nM [Ca2+] alone. The sample number is present in each bar.

