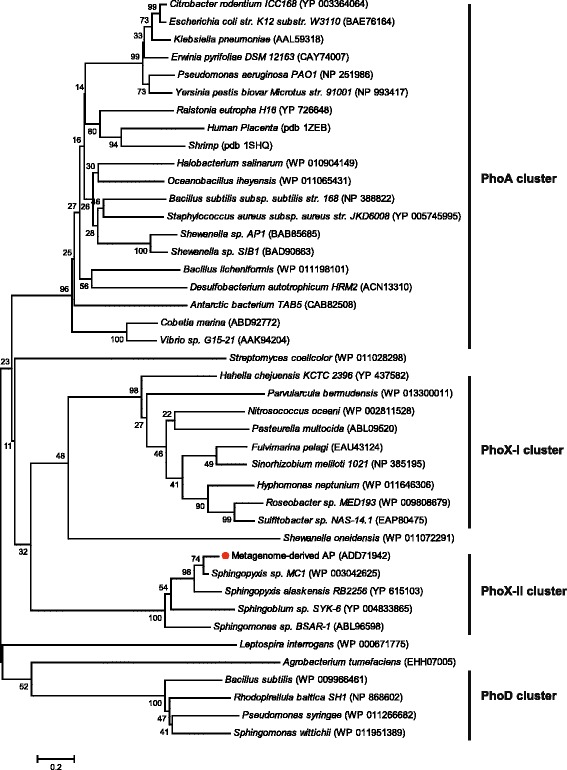
Figure 3.

Phylogenetic analysis of mAP. A phylogenetic tree based on the similarities of full-length deduced amino acid sequences was constructed with MEGA 5.2 software using the neighbor-joining method. GenBank or PDB accession numbers are given after the species designation. Numbers at nodes are bootstrap values based on 1,000 samplings.
