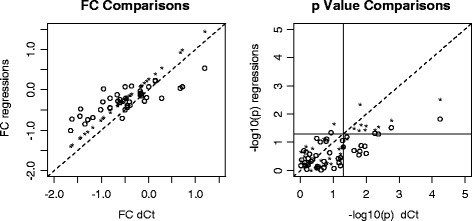
Figure 6.

Fold change and p value comparisons between ΔC t and regression-based normalization methods. FC, fold change. For the ΔCt method, the normalization factor is the mean Ct of the 5 reference genes; For the regression-based method, normalization factors are the multiple regressions of the mean Ct values of target genes (*) or the Ct values of each target gene (o) against the mean Ct of reference genes. The dashed line is the identity line. The vertical and horizontal lines in the right panel mark the significance level of nominal p value 0.05.
