
Figure 10.
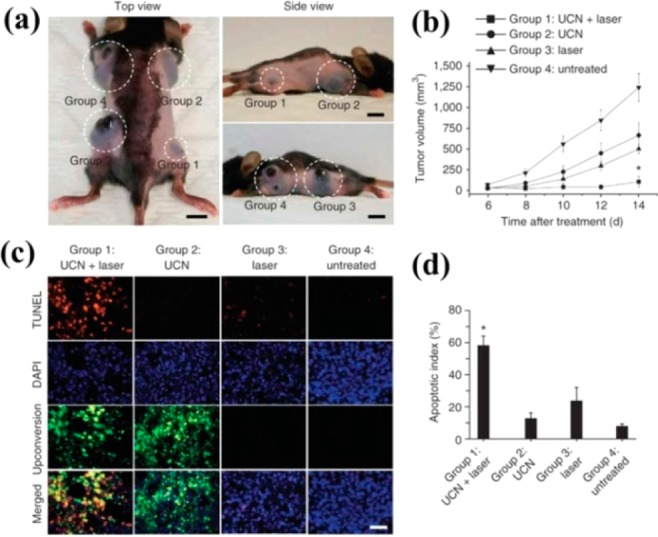
(a) Representative gross photos of a mouse showing tumors (highlighted by dashed white circles) at 14 d after treatment with the conditions described for groups 1–4. Scale bars, 10 mm. (b) Tumor volumes in the four treatment groups at 6, 8, 10, 12, and 14 d after treatment to determine the effectiveness of the treatment in terms of tumor cell growth inhibition. (c) TUNEL staining of tissue sections from the treatment groups at 24 h after treatment to determine the effectiveness of the treatment in terms of tumor cell death by apoptosis. DAPI counterstaining indicates the nuclear region, and upconversion fluorescence imaging indicates the position of the injected UCNP-labeled cell (400× magnification). Scale bar, 20 μm. (d) The apoptotic index charted as the percentage of TUNEL-positive apoptotic nuclei divided by the total number of nuclei visualized by counterstaining with DAPI obtained from counts of randomly chosen microscopic fields. (Reprinted with permission from ref (49). Copyright 2012 Nature Publishing Group.)