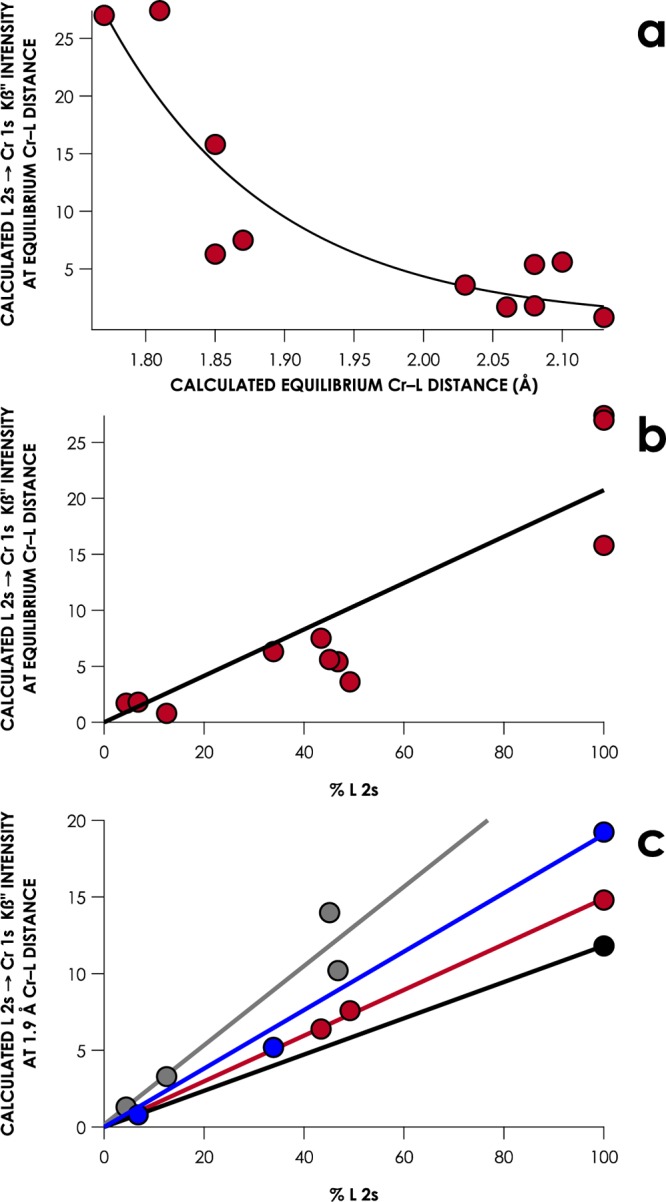
Figure 9.

(a) Plot of calculated Kβ″ intensities as a function of calculated equilibrium Cr–L distances for theoretical compounds listed in Table 3. (b) Plot of calculated Kβ″ intensity at calculated equilibrium Cr–L distances as a function of donor atom 2s character in the free L orbital corresponding to the MO involved in the XES transition for theoretical compounds listed in Table 3 (R2 = 0.80). (c) Plot of calculated Kβ″ intensity at a fixed Cr–L distance of 1.9 Å, as a function of donor atom 2s character in the free L-orbital, corresponding to the MO involved in the XES transition for theoretical compounds listed in Table 3. Data points are grouped by donor atom and linear correlations are constrained to a y-intercept of 0. F, black and O, red (R2 = 0.99); N, blue (R2 = 0.99); C, gray (R2 = 0.91).
