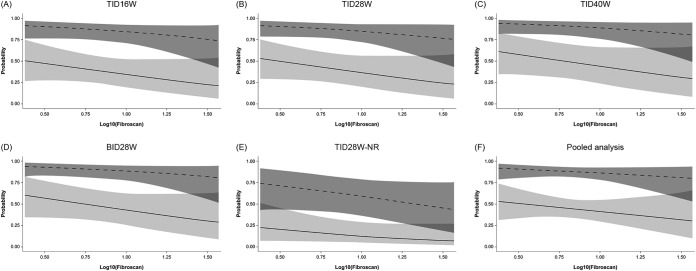
FIG 2.
Probability of SVR12, with 95% confidence limits, in patients with HCV GT-1a (solid lines) or GT-1b (dashed lines) infection according to liver elasticity. For the pooled analysis, the plot is based on a multiple logistic regression model of SVR12 versus log10(Fibroscan) and genotype, with data restricted to ribavirin-containing groups. Odds ratios (ORs), 95% confidence intervals (CIs), and P values are outlined below. BID, twice daily; GT, genotype; NR, no ribavirin; SVR12, sustained virologic response 12 weeks after completion of treatment; TID, three times daily. For the multiple regression model detailed in panels A to E, OR (95% CI) and P value for increasing Fibroscan by 1 log were 0.33 (0.06, 1.80) and 0.2008, respectively. The ORs (95% CIs) and P values for GT-1a versus GT-1b were 0.10 (0.05, 0.20) and <0.0001 and for treatment TID16W versus TID28W were 0.91 (0.36, 2.31) and 0.8489, respectively; those for TID40W versus TID28W were 1.37 (0.48, 3.89) and 0.5550, respectively; those for BID28W versus TID28W were 1.31 (0.50, 3.44) and 0.5782, respectively; those for TID28W-NR versus TID28W were 0.25 (0.08, 0.78) and 0.0173, respectively. For the multiple regression model detailed in panel F, pooled data (excluding the no-RBV arm) are used. OR (95% CI) and P value for increasing Fibroscan by 1 log were 0.47 (0.08, 2.74) and 0.3986, respectively. The OR (95% CI) and P value for GT-1a versus GT-1b in this model were 0.11 (0.05, 0.22) and <0.0001, respectively.

