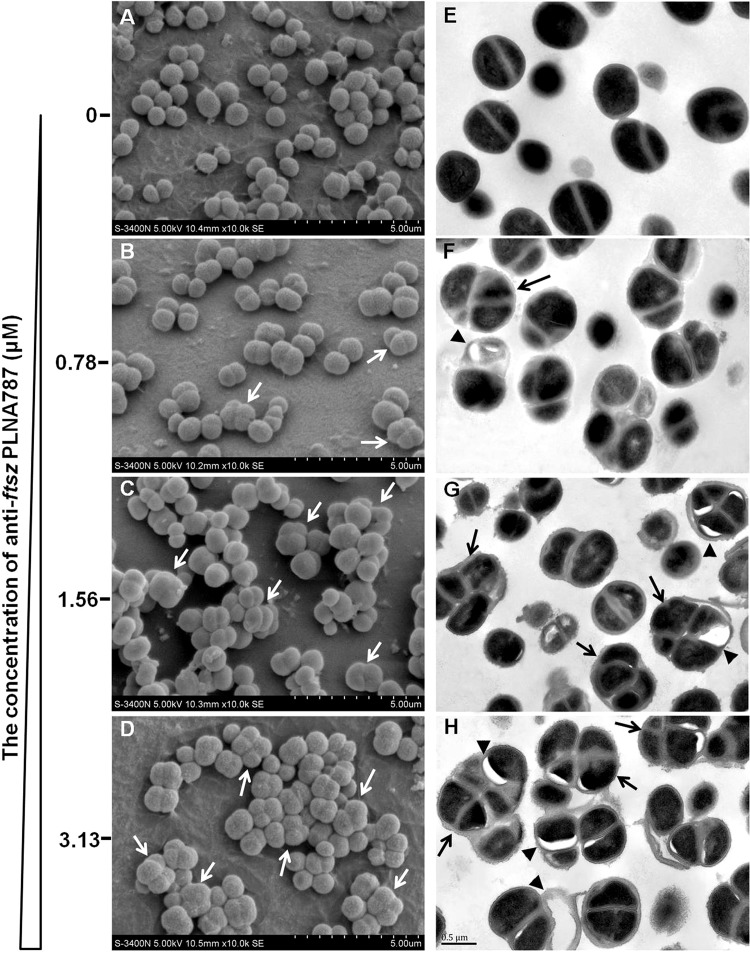
FIG 6.
Morphology of Mu50, investigated by SEM and TEM. Mu50 cultures were treated with different concentrations of anti-ftsZ PLNA787 for 6 h. (A to D) SEM images of Mu50, revealing diploid and tetraploid bacteria (white arrows). (E to H) TEM images, revealing polyploid bacteria (black arrows) and visible bleb-like gaps appearing between the cell membrane and the cytoplasm (black arrowheads).

