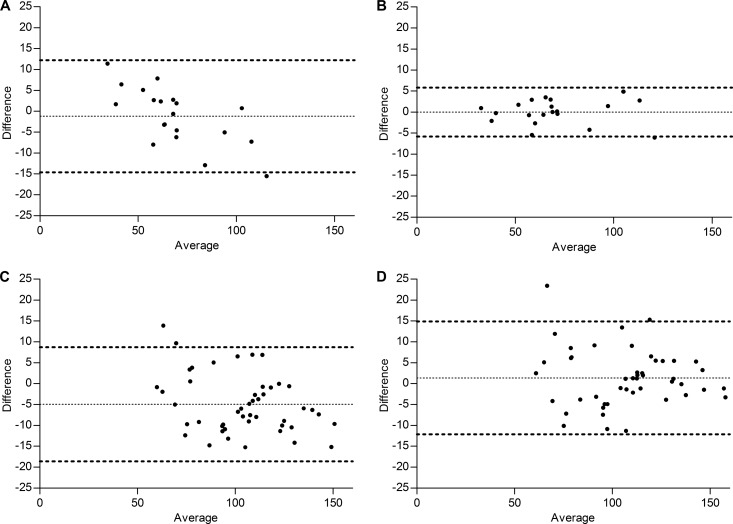
FIG 3.
Bland-Altman plots of the observed anidulafungin AUC0–24 versus the predicted AUC0–24 values with MW\Pharm (A) or regression analysis (B) for critically ill patients (n = 20) and Bland-Altman plots of the observed anidulafungin AUC0–24 versus the predicted AUC0–24 values with MW\Pharm (C) or regression analysis (D) for the healthy volunteers (n = 47).

