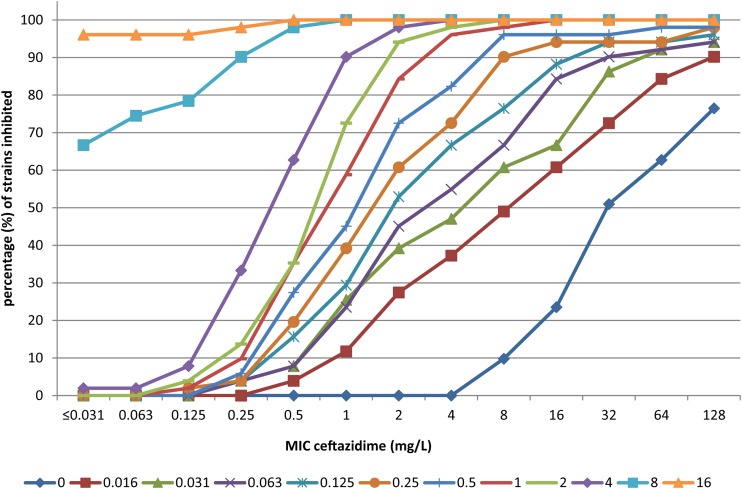
FIG 2.
Cumulative % inhibition of 51 Enterobacteriaceae isolates by ceftazidime for increasing concentrations (symbols below the figure, mg/liter) avibactam. The % inhibition of growth of Enterobacteriaceae is presented on the y axis with the MIC for ceftazidime on the x axis as related to the added concentration of avibactam in differently colored lines.

