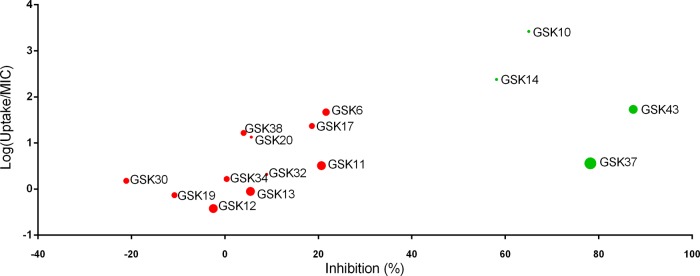
FIG 5.

Correlation between uptake, in vitro MIC, and in vivo zebrafish antibacterial activities of compounds. The measured uptake data in zebrafish larvae were normalized with the in vitro MIC of compounds against M. marinum [log(uptake/MIC)]. This ratio is plotted against the observed percentage of inhibition in the zebrafish M. marinum infection assay. The size of the circles indicates their MIC values, meaning smaller circles correspond to lower MIC values with higher potency. Green color represents compounds significantly reducing bacterial burden in the zebrafish infection model, considered active compounds, while red color indicates inactive compounds.
