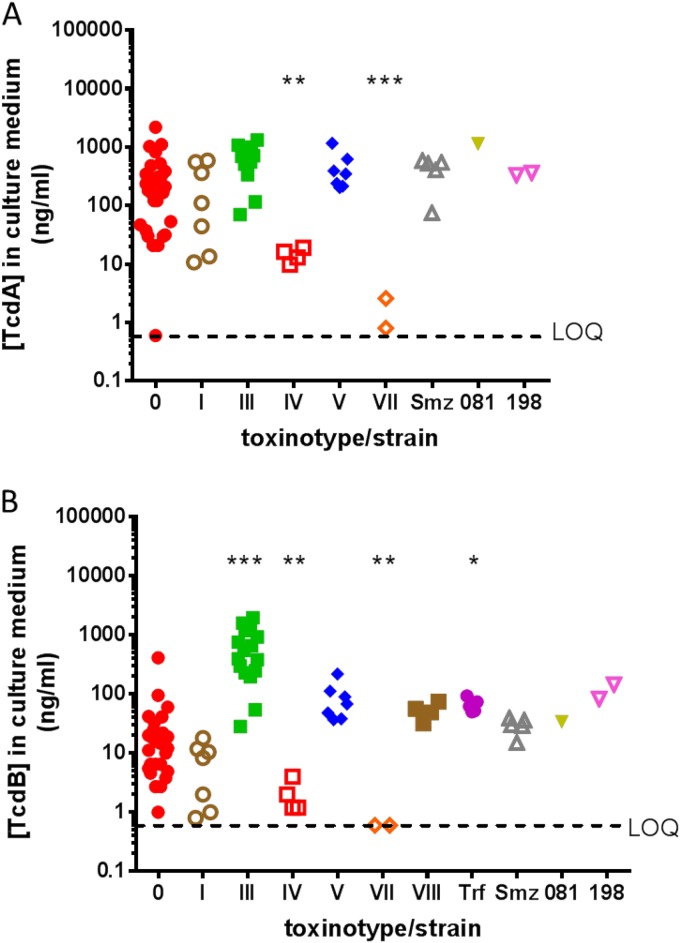
FIG 3.
TcdA (A) and TcdB (B) expression levels in culture supernatants of the various clinical isolates described in Table 3 and Table S1 in the supplemental material, grouped by toxinotype. LOQ, limit of quantitation. *, P < 0.05; **, P < 0.01; ***, P < 0.0001, compared to toxinotype 0.

