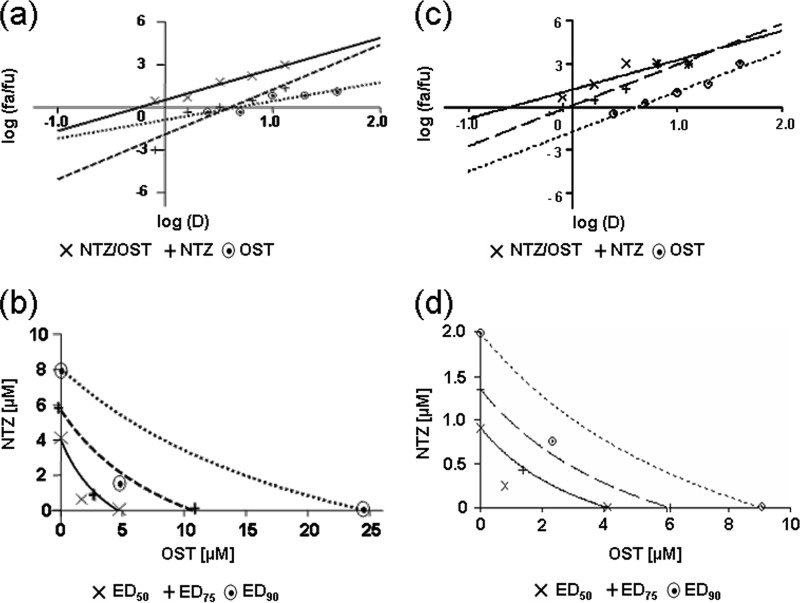
FIG 4.
Analysis of the nitazoxanide-oseltamivir combination treatment in PR8 IAV-infected cells under single-step and multistep viral growth conditions. MDCK cell monolayers were mock infected or infected with PR8 IAV at an MOI of 10 PFU/cell (a, b) or 0.01 PFU/cell (c, d) and treated as described in Materials and Methods for analysis of drug synergism. (a, c) Median-effect curve plots for nitazoxanide (NTZ), oseltamivir (OST), and the combination of the two drugs (NTZ/OST) were generated with the CalcuSyn software (Fa, affected fraction; Fu, unaffected fraction; D, concentration of drug used). (b, d) Conservative isobologram plots of the combination of NTZ and OST. Dose inhibition curves were drawn for NTZ and the NA inhibitor, used alone or in combination. For each drug, equipotent combinations of various doses (ED50, ED75, and ED90 [50%, 75%, and 90% equipotent doses] values) were determined using the CalcuSyn software and were plotted against the fractional concentrations of NTZ and OST on the y and x axis, respectively. Combination index (CI) values, represented by points below the lines, indicate synergy.

