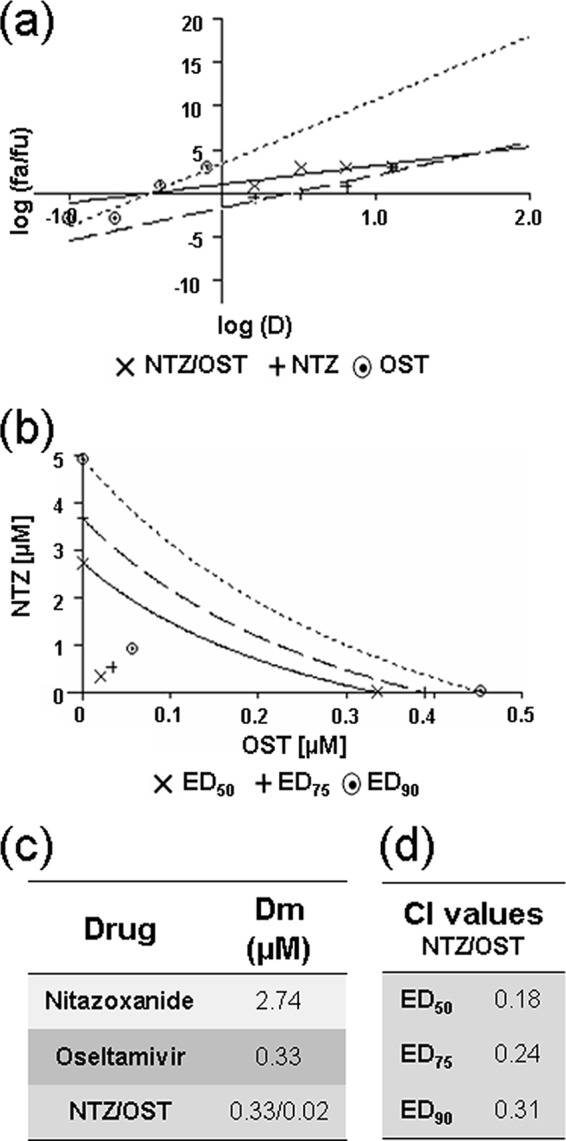
FIG 6.

Analysis of NTZ and oseltamivir synergism in cells infected with the avian A/Ck influenza A virus. MDCK cell monolayers were mock infected or infected with the avian A/Ck IAV strain at an MOI of 2 PFU/cell and treated as described in Materials and Methods for the analysis of drug synergism. (a) Median-effect curve plots for nitazoxanide (NTZ), oseltamivir (OST), and the combination of the two drugs (NTZ/OST) were generated with the CalcuSyn software as described for Fig. 4a. (b) Conservative isobologram plot of the combination of NTZ and OST, as described for Fig. 4b. (c, d) Median-effect doses (c) and CIs (d) for the drugs as a single (nitazoxanide or oseltamivir) or a combination (NTZ/OST; ratio, 16:1) treatment generated with the CalcuSyn software are shown. Dm = IC50 (μM). Data represent the means of results from duplicate samples from a representative experiment of three with similar results.
