
FIG 4.
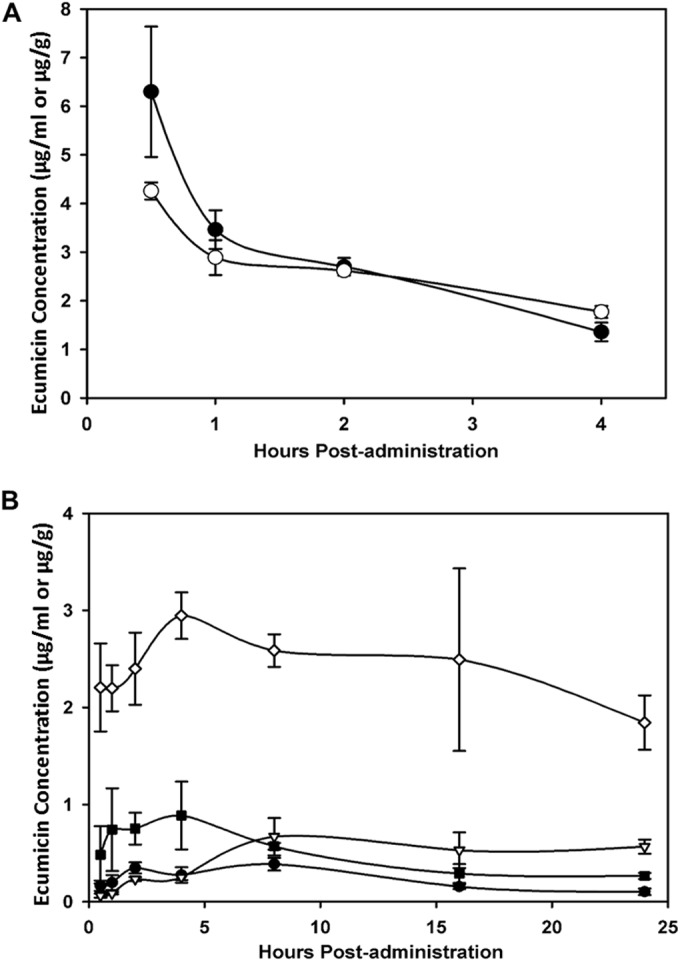
(A) Mean plasma and lung tissue concentrations of ecumicin in mice (n = 3) after a single i.v. dose of ecumicin at 5 mg/kg. ●, plasma; ○, lung tissue. (B) Plasma and lung exposures in mice (n = 3) following single or multiple s.c. doses of ecumicin at 20 mg/kg. ●, plasma after single dose; △, lung tissue after single dose; ■, plasma after 5 daily doses; ◊, lung tissue after 5 daily doses.