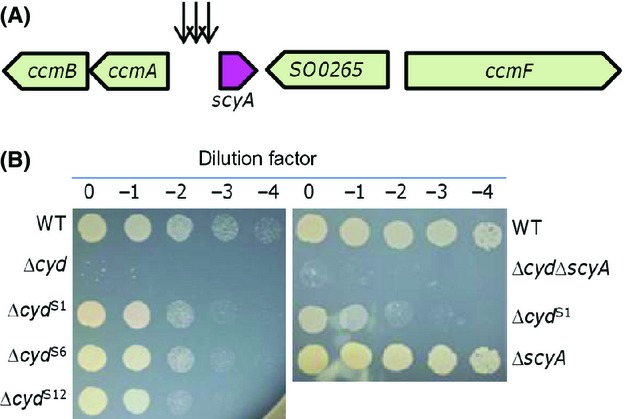
Figure 1.

Transposon screens and terminal phenotypes. (A) Schematics indicating the approximate locations of the transposon insertions. Arrows represent transposon insertion points. (B) Nitrite sensitivity of representative Δcyd suppressors isolated in the screen. Densities of mid-log phase cultures were normalized, 10-fold serial dilutions were prepared, and 5 μL of each dilution was spotted onto LB containing 3 mmo/L nitrite. Experiments were repeated at least three times and similar results were obtained. LB, Luria–Bertani.
