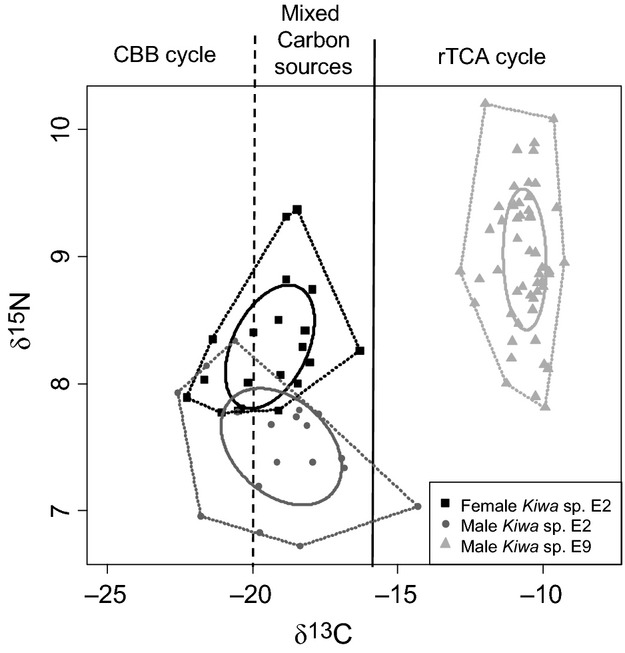
Figure 5.

Isotopic niche of Kiwa sp. nov. East Scotia Ridge (ESR) δ13C and δ15N values for female (squares) and male (circles) Kiwa sp. nov. ESR from E2 and male (triangle) Kiwa sp. nov. ESR from E9 with their respective standard ellipse area (solid line) with a boundary plotted (dotted line) around the extreme points to aid visualization. The dashed and solid vertical lines represent the range of δ13C values for different carbon fixation pathways: <−20‰ for the Calvin-Benson-Bassham (CBB) cycle, >−16‰ for the reductive tricarboxylic acid (rTCA) cycle and −20‰ to −16‰ for mixing of the two carbon sources.
