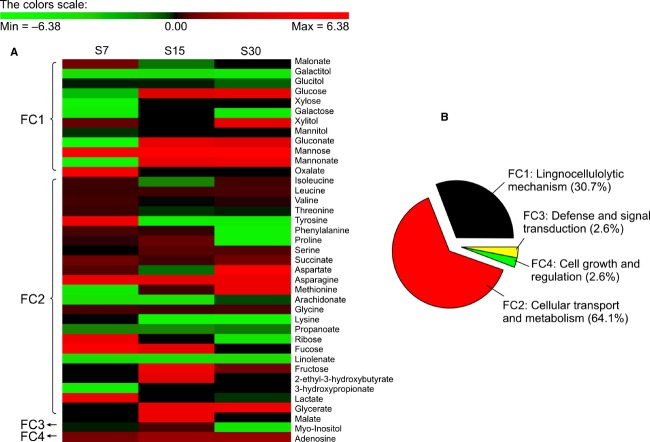
Figure 1.
Metabolomic profiling of Phanerochaete chrysosporium grown with rice straw versus control. (A) Expression profiles from culture grown on RS for 7 (S7), 15 (S15), and 30 (S30) days. Hierarchical clustering of 39 metabolites showing considerable variation in expression with |fold| > 2 and 0.01 ≤ P < 0.05 in RS culture. The color scale reflects the logarithmic unit in comparison with the control. (B) Functional clustering of the 39 metabolites was grouped with biochemical functions released by the National Institute of Standards and Technology database.

