Figure 2.

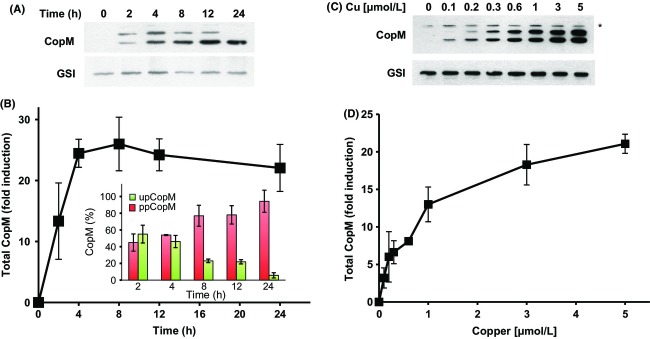
CopM accumulates in response to copper in a time- and dose-dependent manner. (A) Western blot analysis of CopM levels for 24 h after copper addition in the WT strain. Cells were grown in BG11C-Cu medium to mid-log growth phase and exposed for 24 h to copper 1 μmol/L. Five micrograms of total protein from soluble extracts was separated by 15% SDS-PAGE and analyzed by western blot to detect CopM, and glutamine synthetase type I (GSI). (B) Quantification of total CopM levels in response to copper addition in the WT strain. Western blot signal of three independent experiments as the one shown in A were quantified using ImageJ program. CopM levels were normalized to the GSI signal. Error bars represent SE. Inset: Quantification of the relative proportion of ppCopM (red bars) and upCopM (green bars). (C) Western blot analysis of CopM levels after the addition of different copper concentrations in the WT strain. Cells were grown in BG11C-Cu medium to mid-log growth phase and exposed for 3 h to the indicated copper concentration. Five micrograms of total protein from soluble extracts was separated by 15% SDS-PAGE and subjected to western blot to detect CopM and GSI. (D) Quantification of total CopM levels in response to different copper concentrations in the WT strain. Western blot signal of three independent experiments as the one shown in C was quantified using ImageJ program. CopM levels were normalized to the GSI signal. Error bars represent SE.
