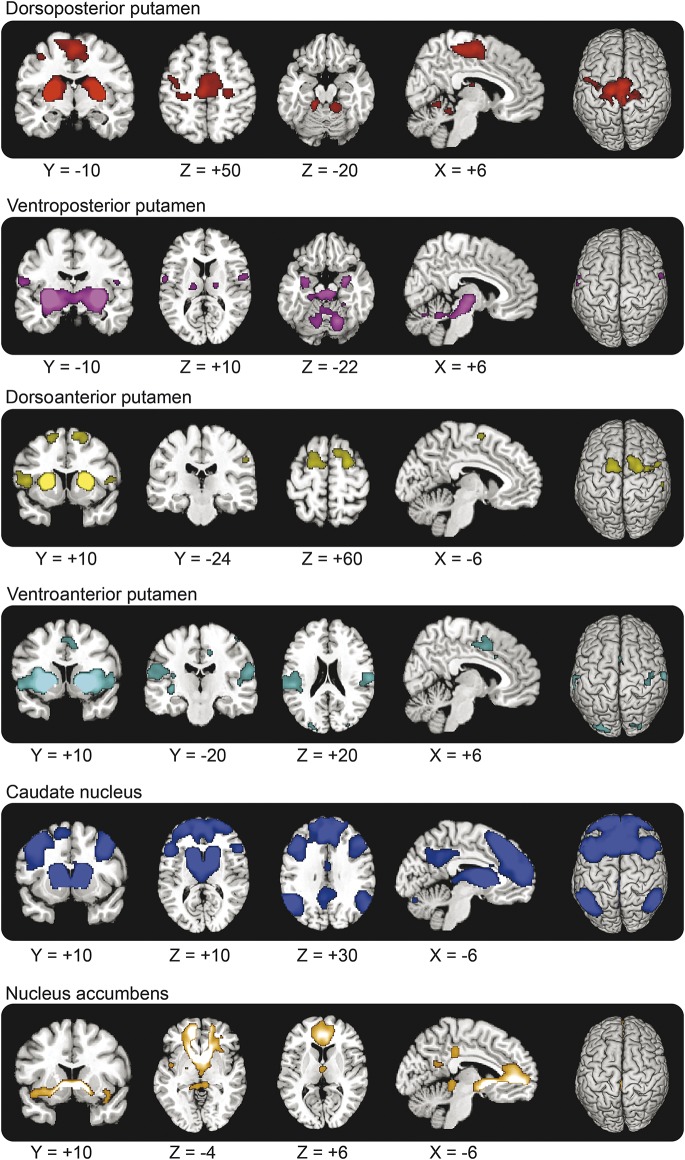
Figure 2. Shared corticostriatal connectivity between LRRK2 G2O19S mutation carriers and noncarriers.
The images represent SPM{t} maps of similar functional connectivity across groups, thresholded at p < 0.001 uncorrected (for graphical purposes), with a cluster extent threshold of 50 voxels, overlaid on anatomical images from a representative subject of the MNI (Montreal Neurological Institute) series.

