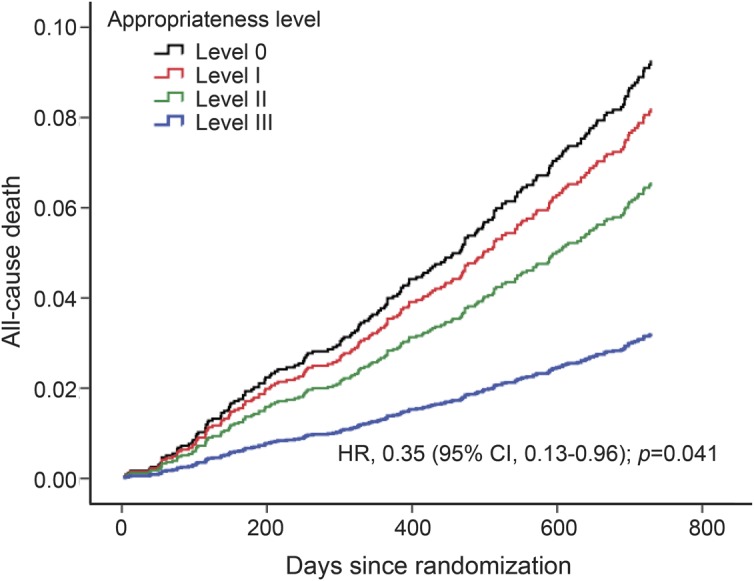
Figure 2. Adjusted effect of drug treatment on all-cause death after noncardioembolic stroke.

Secondary prevention medication classes were categorized by appropriateness level strata (0 to III) depending on the number of drugs prescribed divided by the number of drugs potentially indicated for each patient. CI = confidence interval; HR = hazard ratio.
