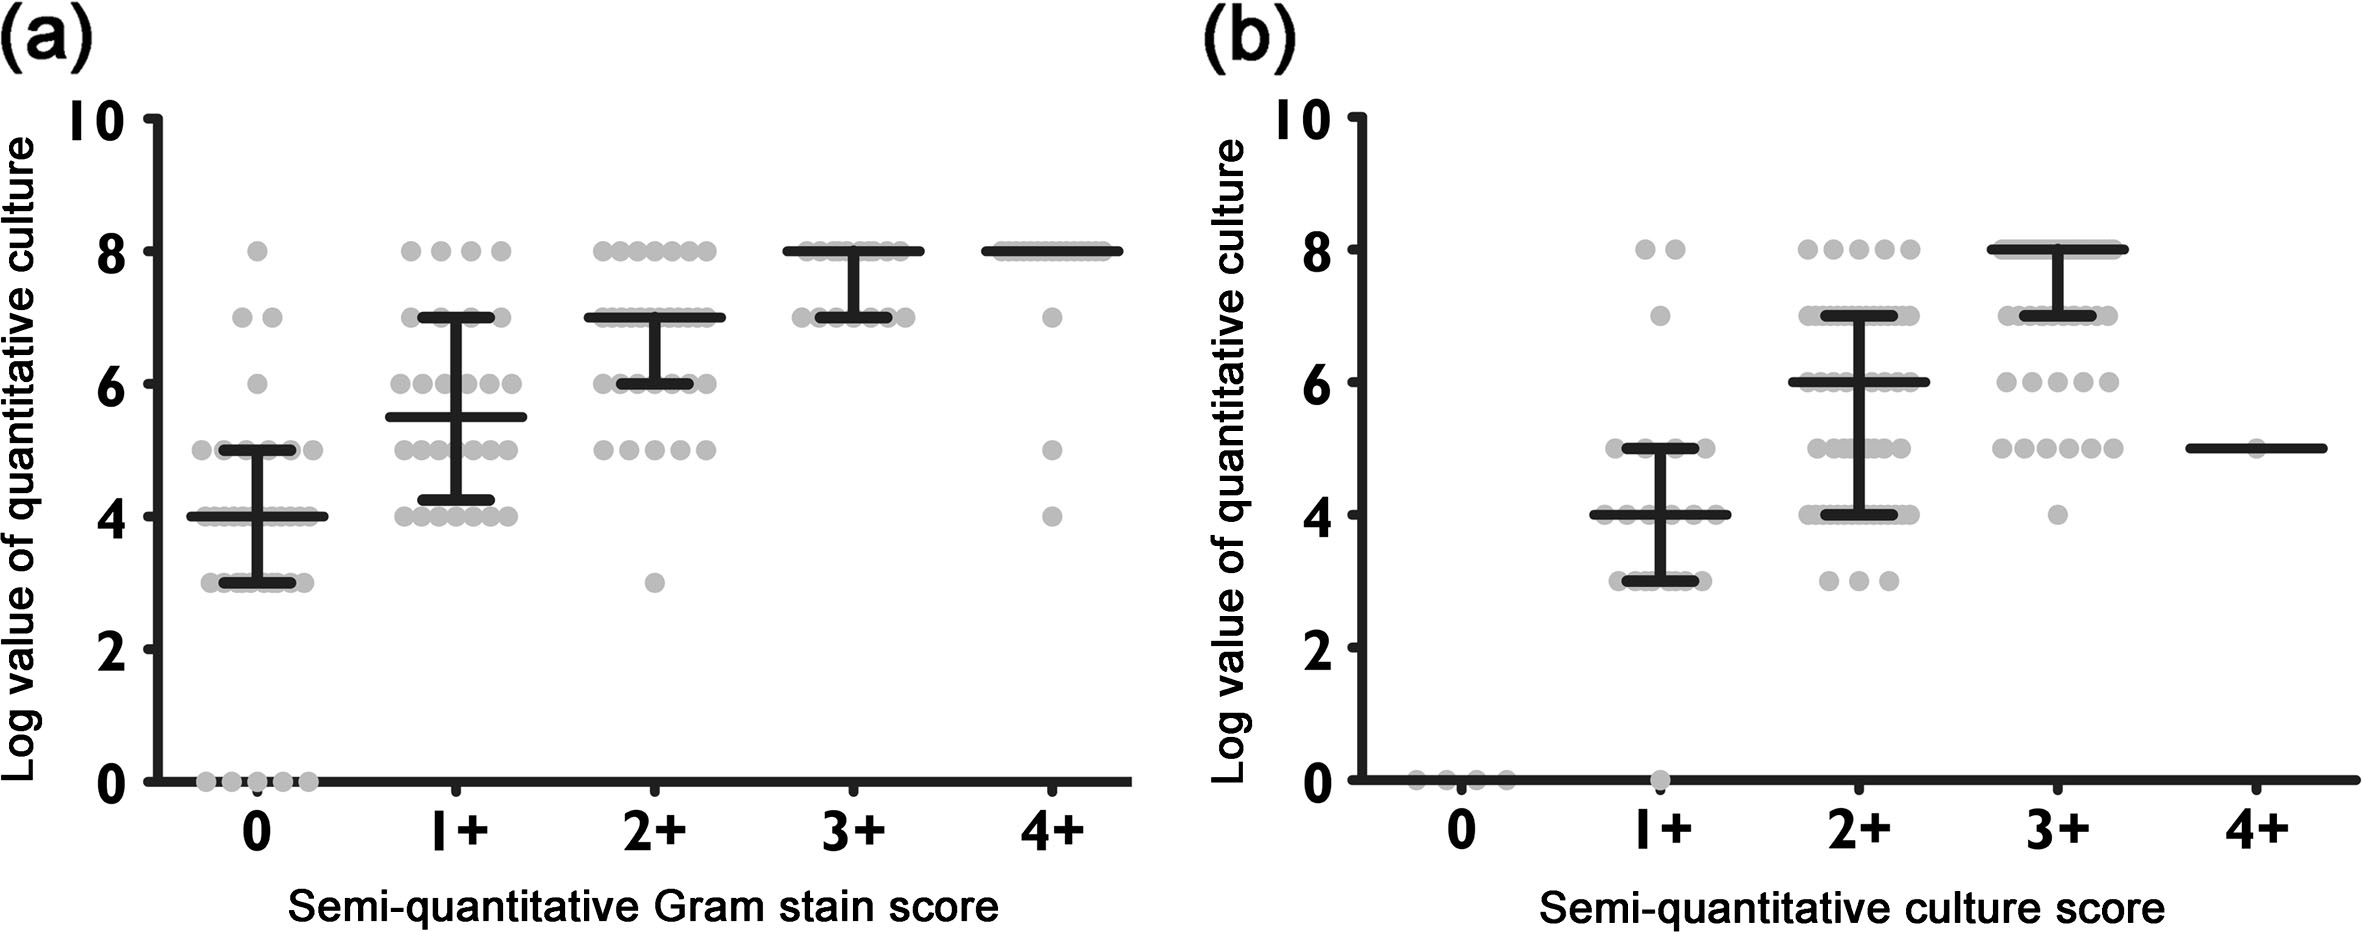
Figure 1.

Comparison between the semi-quantitative Gram stain or culture scoring and quantitative results. (a) Scatter plot comparing the log count of quantitative culture results and the semi-quantitative Gram stain score; (b) scatter plot comparing the log count of quantitative culture results and the semi-quantitative culture score. Each center line represents the median, whereas top and bottom lines denote the interquartile range (IQR, 25th and 75th percentiles).
