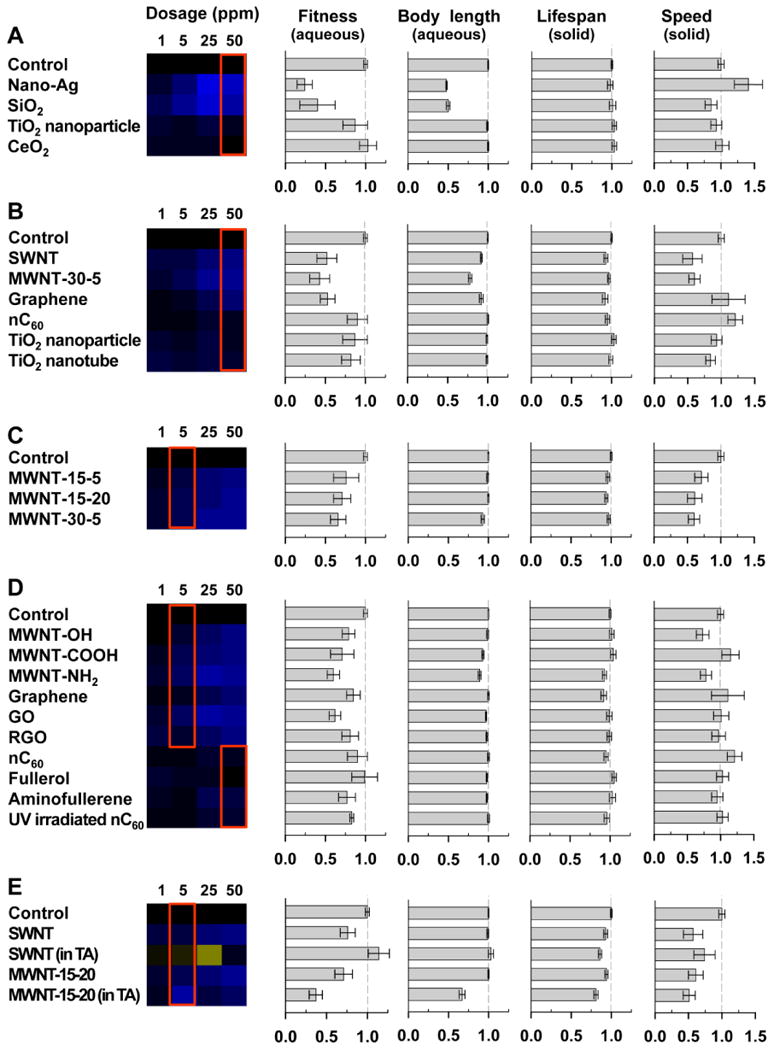
Figure 3.

Different chemical properties affect nanomaterial toxicity. Toxicity was impacted by nanomaterial constituent elements (A), shape (B), size (C), surface chemistry (D), and exposure media (E). Heat maps represent fitness at four different concentrations of nanomaterials. Bar charts represent means and 95% confidence intervals for each endpoint at selected exposure concentrations: the concentrations for the fitness and body length charts are marked by a red box in each heat map; the concentrations for all lifespan and speed charts is 2.08 μg/cm2 well surface. Aqueous and solid indicate the type of exposure media for each assay. Sample size: n > 5 wells for fitness, n > 101 worms for body length, n > 195 worms for lifespan, and n > 71 tracks for locomotion.
