
Fig. 2.
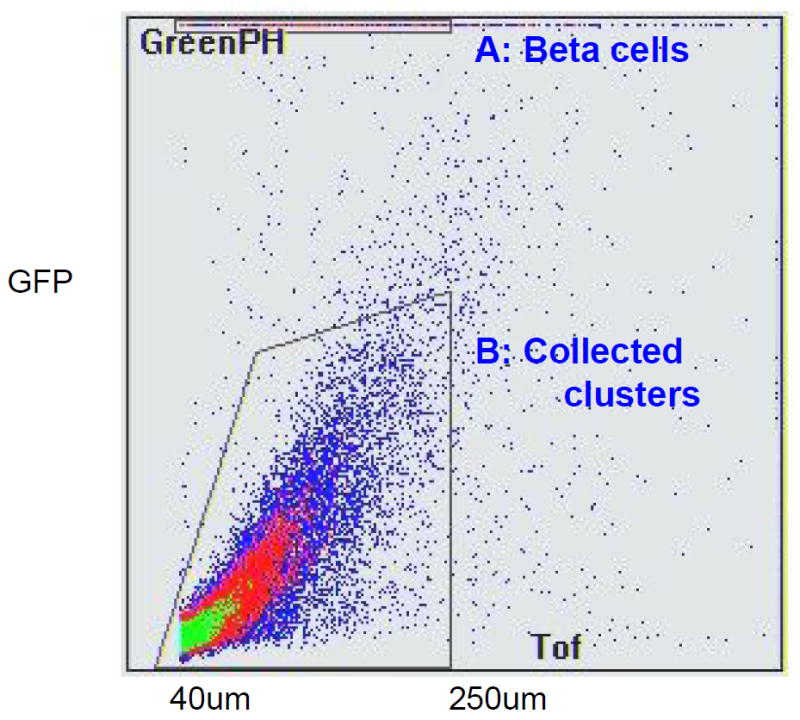
GFP-negative aggregates collected with COPAS sort. GFP-negative clusters (40 to 250 μm diameter) were collected for culturing (Gated area shown by black dashed lines). A:Beta cells, B: collected clusters. Time of flight represents axial length of the object (size); green-peak height (Greeen PH) shows GFP emission