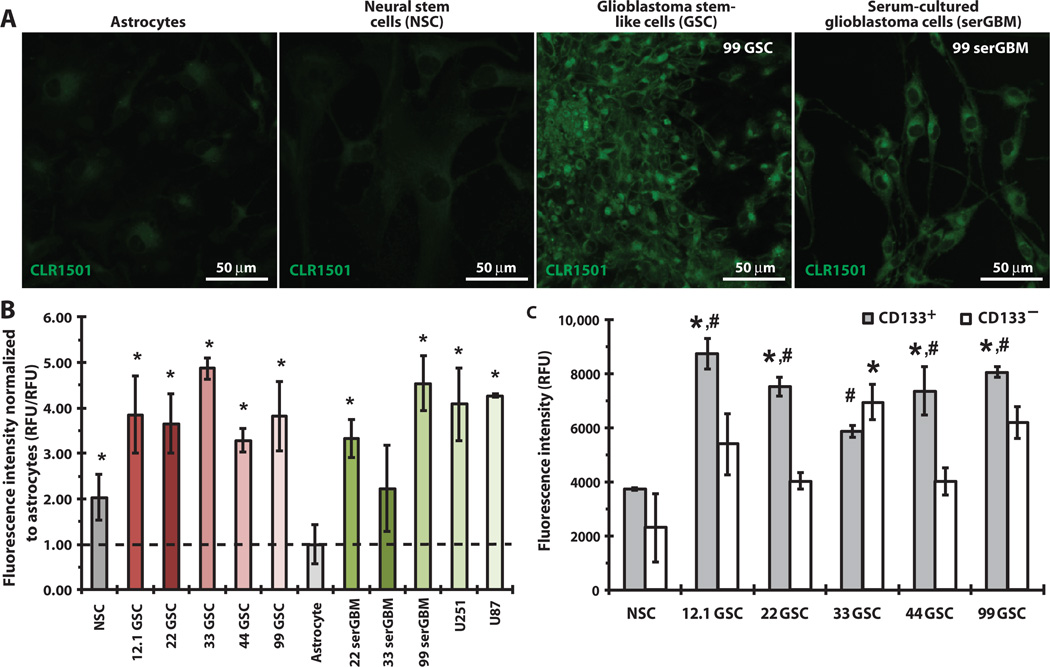
Fig. 3. CLR1501 fluorescent labeling of GSCs in vitro.
(A) GSCs (line 99) were treated overnight with CLR1501. CLR1501 uptake was visualized with confocal microscopy and compared to matched serGBM, normal human astrocytes, and human NSCs. (B) Flow cytometry was performed to quantify CLR1501 uptake after 24 hours in GSC patient–specific lines 12.1, 22, 33, 44, and 99; serGBM lines 22, 33, 99, U251, and U87; NSCs; and astrocytes. Data are means ± SD of three independent experiments. *P < 0.05, Student’s t test compared to astrocyte. RFU, relative fluorescence unit. (C) CLR1501 labeling of the CD133+ subpopulation of GSCs was analyzed using flow cytometry. Data are means ± SD of three independent experiments. *P < 0.05 versus line-matched CD133+ or CD133− cells; #P < 0.05 versus NSCs, Student’s t test.

