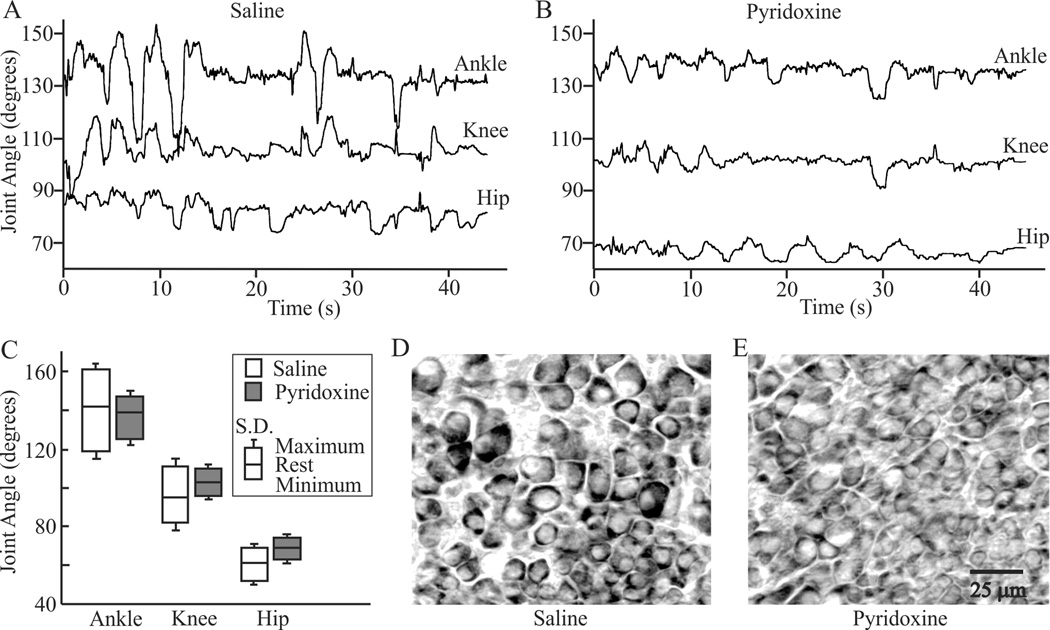
Figure 1.
Effects of pyridoxine on E9 leg motility and DRG morphology. Representative joint angle vs. time plots of the ankle, knee and hip for individual motility episodes are shown from saline- (A) and pyridoxine-treated (B) embryos. Notice that the general pattern of concurrent extension and flexion of the joints is maintained after pyridoxine treatment. C) Average joint angle characteristics for the ankle knee and hip of saline- and pyridoxine-treated embryos. The middle line of each box represents the average resting angle. The average joint extension and flexion are shown relative to the resting angle as the top and bottom lines of the boxes respectively. Standard deviations from the mean extension and flexion are shown as error bars. Representative images of small and large neurons in the third lumbosacral DRG from (D) saline and (E) pyridoxine-treated embryos. Images are from the ventral lateral edge of each ganglion.

