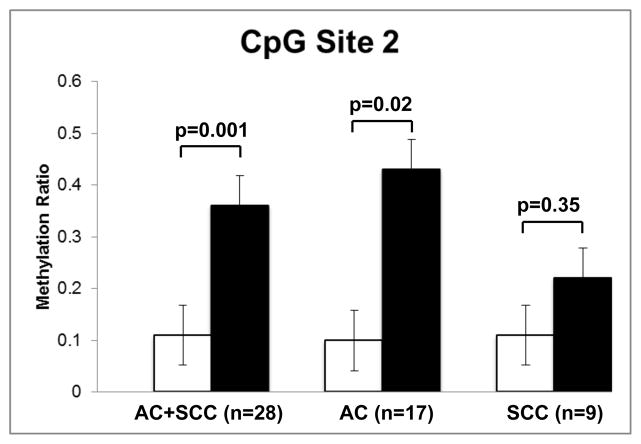
Figure 2. DNA Methylation ratios of CpG Site 2 in cancer and adjacent NC lung samples.
Statistical differences were observed when all lung cancer tissues (AC+SCC) were compared to adjacent NC lung tissue (p=0.001, n=28), and the AC group to adjacent NC lung tissue (p=0.02, n=17). No statistically significant differences (p=0.35, n=9) were observed when the SCC and NC were compared. Results are expressed as mean ± SEM.

