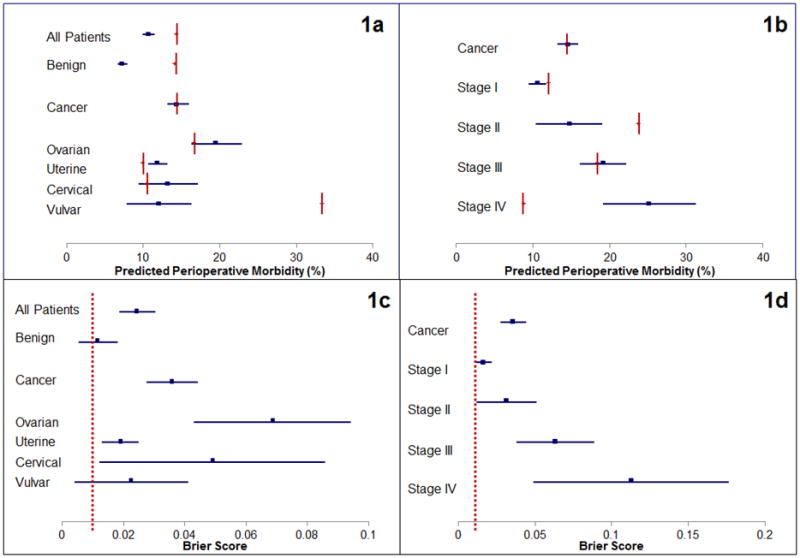
Figure 1.

Predicted outcomes (blue lines) presented with 95% confidence intervals and experienced outcomes (red vertical lines). Figure 1a also illustrates the predicted outcome based on tissue of origin for different cancers. Figure 1b presents predicted and experienced outcomes of cancer procedures stratified by stage of disease. Figures 1c and 1d illustrates the Brier score result (blue lines) with 95% confidence intervals and the NSQIP expected model outcome (0.01) illustrated by the red vertical line, which corresponds to 90% forecast accuracy.
