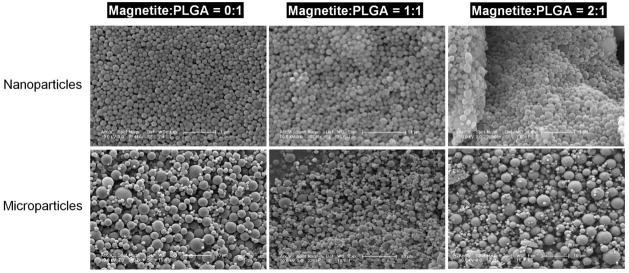
Figure 1.

Scanning electron micrographs of magnetic PLGA particles made with 2 concentrations of magnetite — first column is 0:1 magnetite/PLGA, second column is 1:1 magnetite/PLGA and third column is 2:1 magnetite/PLGA. Top row is nanoparticles and bottom row is microparticles. Note the regular, spherical appearance of all fabricated particles. Scale bar is 1 μm for NPs and 10 μm for MPs.
