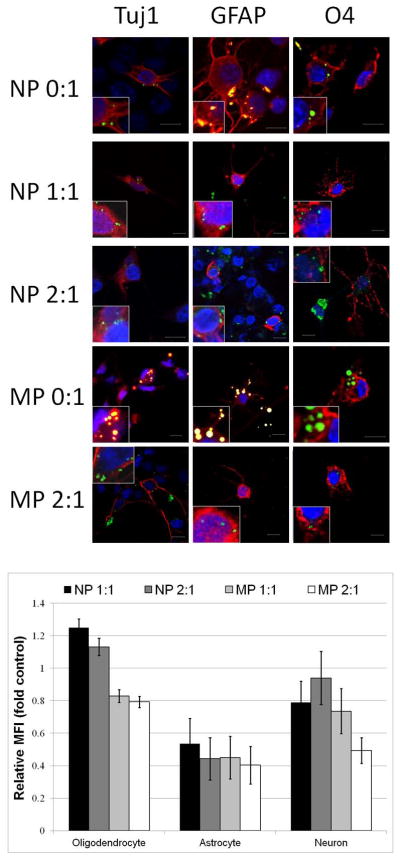
Figure 4.

a) Confocal fluorescence microscopy analysis of neural stem cell differentiation. Row and column headers indicate particle type and antigen stained for. All primary antibodies were labeled with secondaries that fluoresce red showing Tuj1+ neurons, GFAP+ astrocytes, or O4+ oligodendrocytes. Nuclear DNA is labeled with 4′,6-diamidino-2-phenylindole (DAPI) shown in blue, while green fluorescence is that of coumarin-6 incorporated in particles. For non-magnetic particles, bleeding from the green channel to the red channel was observed as orange overlap, possibly due to very high levels of coumarin-6 incorporation. Insets show digital expansions of cells highlighting intracellular presence of particles. Scale bar is 10 microns. b) Quantification of proportion of differentiated cell type relative to unlabeled cells. Data are means +/− SEM.
