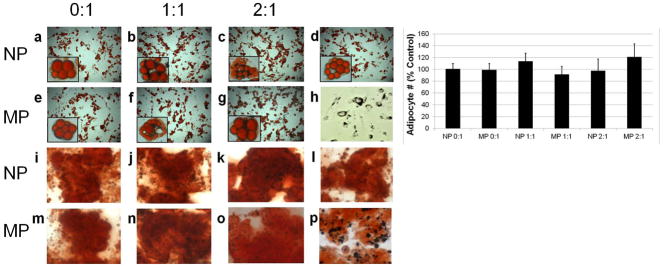
Figure 5.

Light microscopy of mesenchymal stem cell labeling and differentiation. Top two rows are adipogenic differentiation (Oil red O staining). Bottom two rows are osteogenic differentiation (Alizarin red staining). Row and column headers indicate particle formulation. Panels d and l) are differentiation of unlabeled cells. Panel h) is cells labeled with 1:1 MP prior to differentiation. Panel p) is a digital zoom of panel o) showing the presence of particles in the cells. Insets in a–g) are optical zoomed images of individual adipocytes containing particles, or for panel d), no particles. Chart compares proportion of labeled cells that differentiated into adipocytes to unlabeled cells that differentiated into adipocytes. Data are means +/− s.d.
