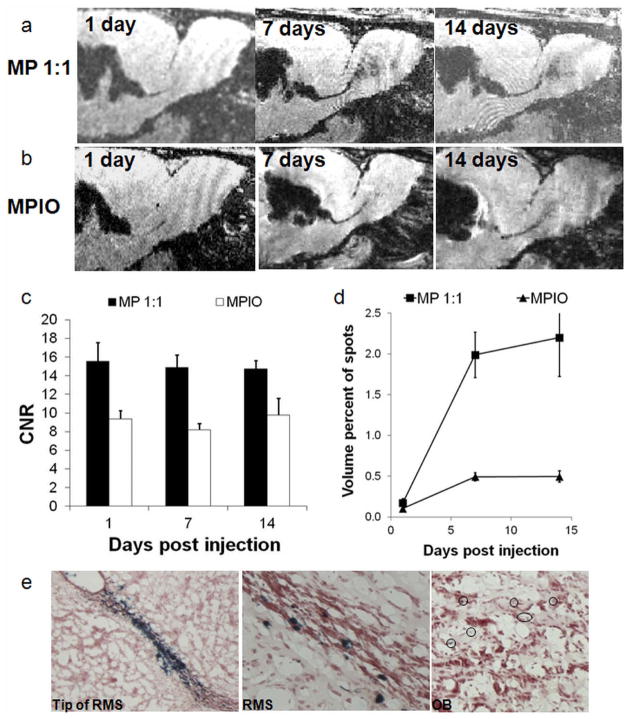
Figure 8.
In vivo MRI of endogenous neuroblasts migration. MRI montage of same animal at level of SVZ – RMS – OB injected with a) MP 1:1 or b) inert MPIOs. Days of MRI are given in panels. c) CNR measurement of dark contrast within RMS. d) Volume of dark contrast in the OB. e) Prussian blue staining for iron in SVZ, RMS, and OB showing presence of iron specifically and throughout the migratory pathway. Data in panels c and d are mean +/− SEM.

