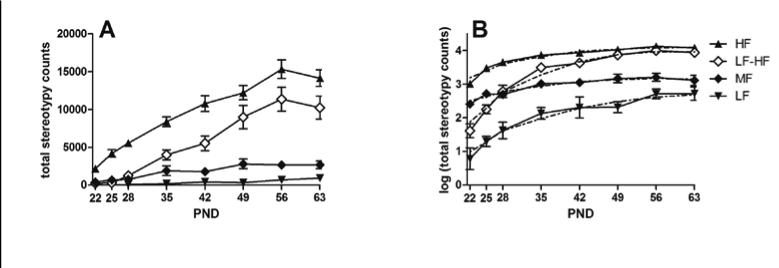
Figure 3.
a: Mean stereotypy counts at each of eight developmental time points for each of four trajectory groups. Figure 3b: Mean log transformed stereotypy counts from the estimated mean (solid line) and one from the fitted quadratic (dashed line) for four trajectory groups as provided by Proc Traj. Error bars are ± SEM.

