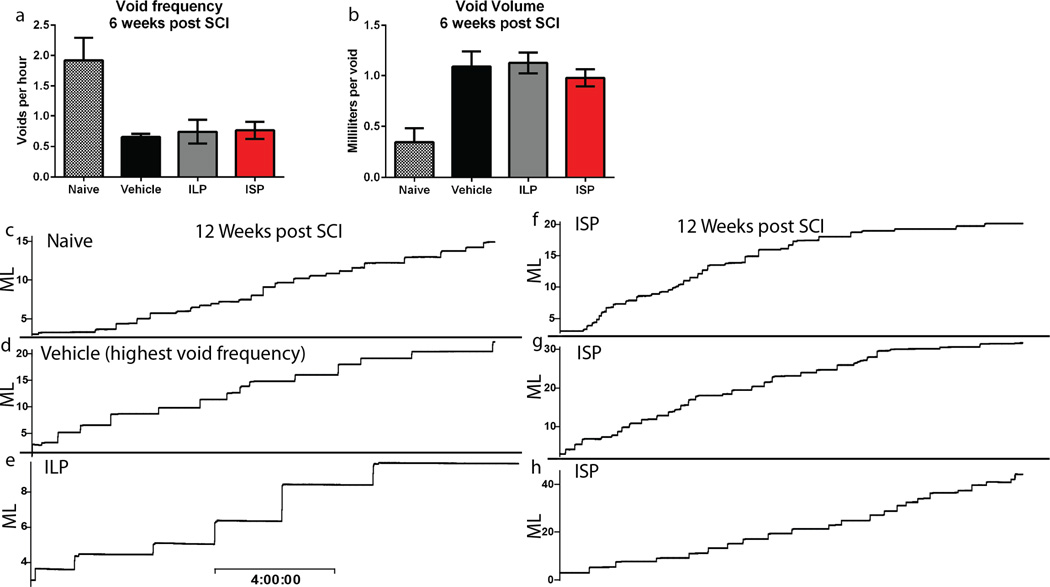
Extended Data Figure 6. Metabolic cage analysis at 6 w post injury.
A-B: Void frequency and average void volume at 6w post injury. n = 11 naïve, 21 vehicle, 10 ILP and 26 ISP. C-H: Representative smoothed metabolic cage traces of a normal animal (C) and 5 treated animals (D-vehicle, E-ILP and F-H, ISP) 12 w post injury. Void volume is plotted (in ml) as a function of time, scale bar = 4h.

